When comparing means across three or more groups, the go-to test is often one-way ANOVA. But ANOVA comes with assumptions — and when those assumptions break down, you need an alternative. That alternative is the Kruskal-Wallis test.
This post walks through the decision-making process with a real example from clinical research.
The Decision Flowchart
The logic is simple: check two assumptions. If both hold, use ANOVA. If either fails, use Kruskal-Wallis.
What Are We Actually Checking?
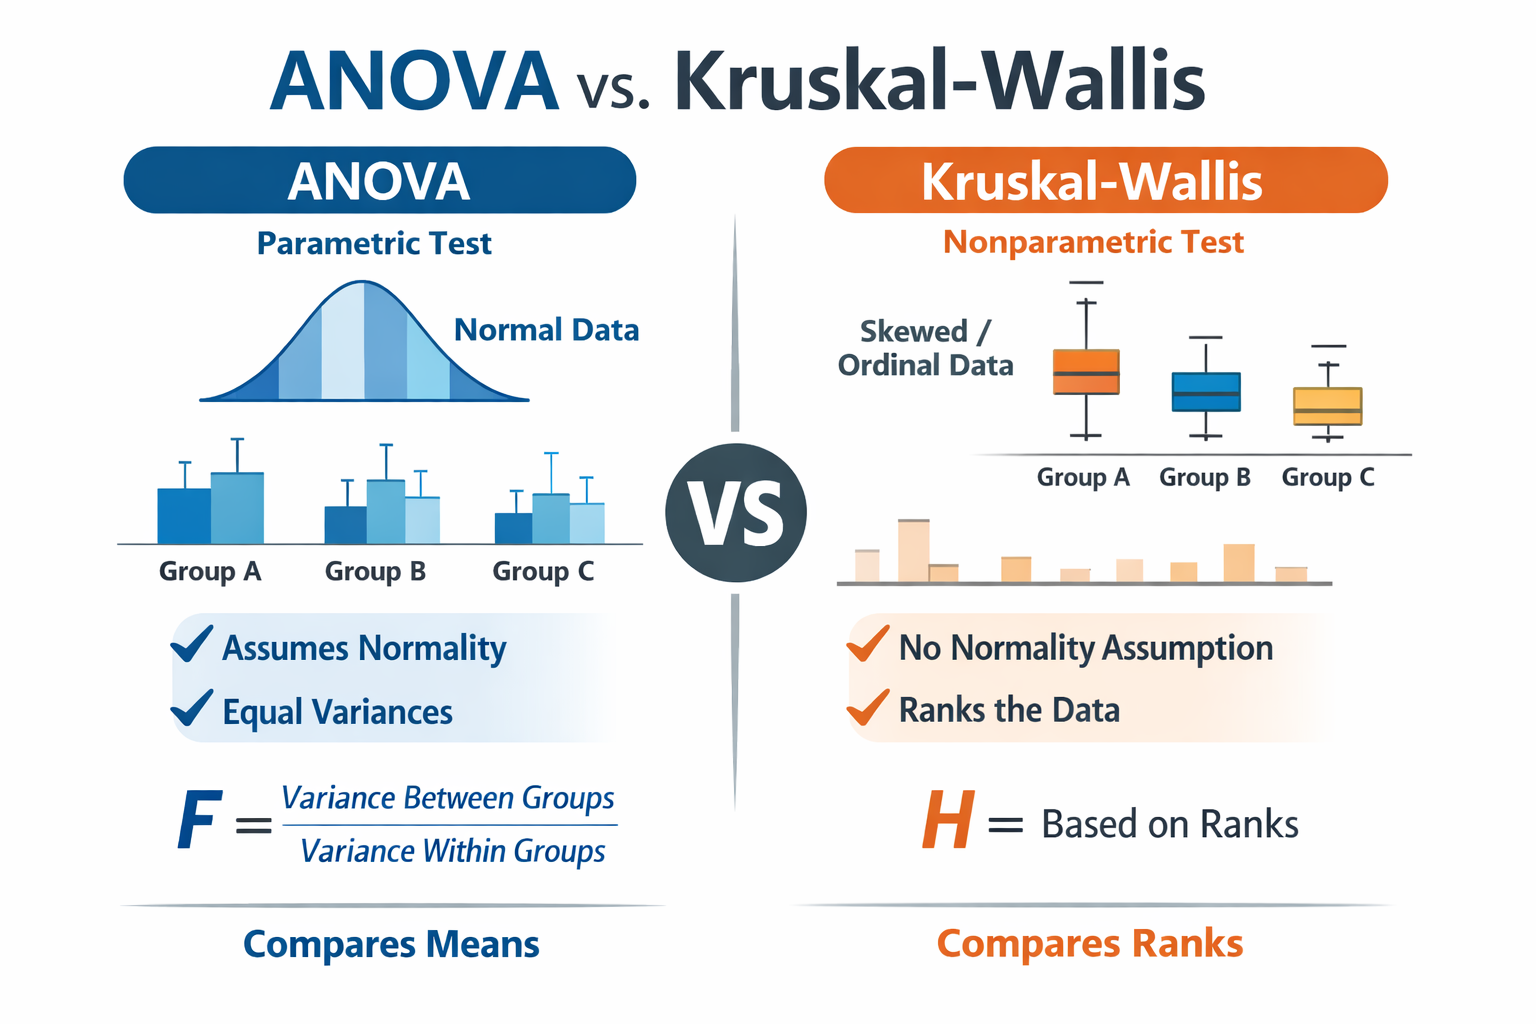
Assumption 1 — Normality means the data within each group follows a bell-shaped distribution. We test this with the Shapiro-Wilk test. If p > 0.05, we accept that the data is approximately normal.
Assumption 2 — Homogeneity of variances means the spread of data is roughly equal across groups. We test this with Levene’s test. If p > 0.05, the variances are considered equal.
ANOVA needs both. Kruskal-Wallis needs neither — it works on ranks instead of raw values, making it robust to non-normal data and unequal variances.
A Worked Example
Suppose we’re comparing patient age across four ICU groups: COVID-19, Non-Pneumonia Control, Bacterial Pneumonia, and Influenza. Here are the Shapiro-Wilk results for each group:
| Group | W statistic | p-value |
|---|---|---|
| COVID-19 | 0.943 | 0.589 |
| Non-Pneumonia Control | 0.889 | 0.270 |
| Bacterial Pneumonia | 0.783 | 0.059 |
| Influenza | 0.925 | 0.509 |
All four p-values are above 0.05, so normality holds.
Next, Levene’s test gives us F = 0.90, p = 0.455. Since p > 0.05, equal variances hold.
Both assumptions pass → we use one-way ANOVA.
The ANOVA result: p = 0.612, meaning there is no significant difference in age across the four groups.
When It Goes the Other Way
Now consider day of intubation for the same four groups. The Shapiro-Wilk results:
| Group | W statistic | p-value |
|---|---|---|
| COVID-19 | — | 0.0003 |
| Non-Pneumonia Control | — | 0.078 |
| Bacterial Pneumonia | — | 0.306 |
| Influenza | — | 0.0001 |
Two groups (COVID-19 and Influenza) have p < 0.05. Normality is violated. We don’t even need to check Levene’s test — we go straight to Kruskal-Wallis.
The Kruskal-Wallis result: p = 0.139, meaning no significant difference across groups.
The Math Behind Each Test
ANOVA (parametric)
ANOVA compares the variance between groups to the variance within groups using the F-statistic:
\[F = \frac{\text{MS}_{\text{between}}}{\text{MS}_{\text{within}}}\]Where:
\[\text{MS}_{\text{between}} = \frac{\sum_{i=1}^{k} n_i (\bar{x}_i - \bar{x})^2}{k - 1}\] \[\text{MS}_{\text{within}} = \frac{\sum_{i=1}^{k} \sum_{j=1}^{n_i} (x_{ij} - \bar{x}_i)^2}{N - k}\]A large F means the group means differ more than you’d expect from random variation alone.
Kruskal-Wallis (non-parametric)
Instead of using raw values, Kruskal-Wallis ranks all observations from smallest to largest, then compares the average ranks across groups:
\[H = \frac{12}{N(N+1)} \sum_{i=1}^{k} \frac{R_i^2}{n_i} - 3(N+1)\]Where R_i is the sum of ranks in group i, n_i is the group size, and N is the total sample size. The test statistic H follows a chi-squared distribution with k − 1 degrees of freedom.
Because it uses ranks, extreme values or skewed distributions don’t distort the result.
Quick Reference
| ANOVA | Kruskal-Wallis | |
|---|---|---|
| Type | Parametric | Non-parametric |
| Compares | Group means | Group rank distributions |
| Requires normality | Yes | No |
| Requires equal variances | Yes | No |
| Sensitive to outliers | Yes | No |
| Power when assumptions met | Higher | Slightly lower |
Key Takeaway
Don’t default to one test. Let the data tell you. Run Shapiro-Wilk and Levene’s test first, then let the results guide your choice. When in doubt, Kruskal-Wallis is the safer option — it sacrifices a small amount of statistical power in exchange for robustness.
Comments
Leave a comment using your GitHub account. Your feedback is appreciated!